5. Lines
5.5. Raman OVI 6830 7088
First detected by Joy & Swings (1945) in the spectrum of the recurrent nova RS Oph Raman (OVI 6830), these lines remained a mystery until 1989. Joy & Swings erroneously assigned them to [Kr III]. For a long time, they were marked by " ? " in publications about symbiotic stars.
Feast discovered the 7088 band, in the star Hen 1242 (Webster 1973).
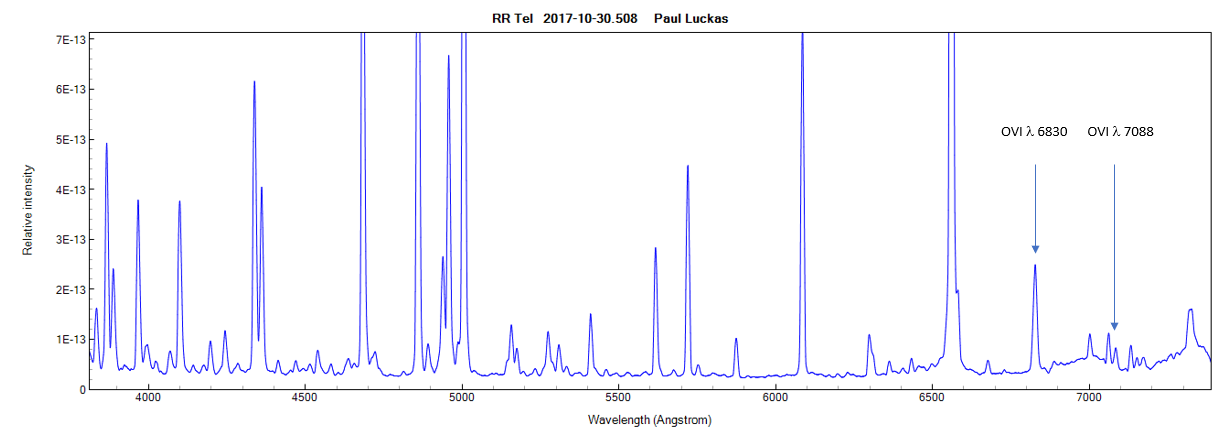
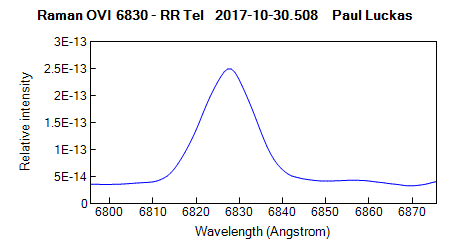
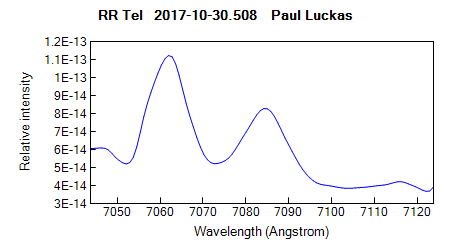
Raman OVI 6830 7088 in RR Tel - Spectrum obtained by Paul Lukas (Alpy 600 - R = 600)
Allen (1980) discussed in detail the identification of the lines:
- The 6830 band is only observed in symbiotics stars. More than 50% of symbiotics show this line.
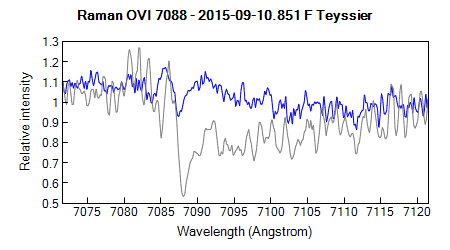
The weaker 7088 band is seen in spectra showing a strong 6830 emission. The intensity of the two lines is correlated: EW(6830)/EW( 7088) ~5.5 (+/-0.6) and ratio of intensities ~ 4.
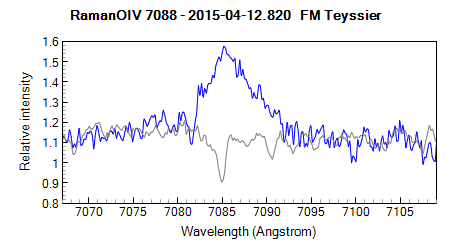
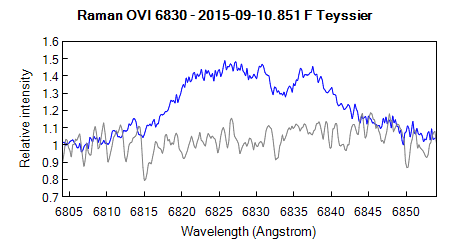
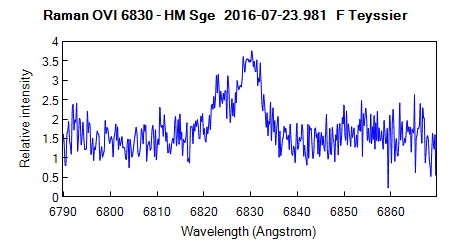
- The bands profiles have a typical width of 20 A, they differ from one star to another, they are often double peaked, the profiles of the two bands are almost similar. The bands have different profile from forbidden lines and must arise in a different physical region
- They are observed in high ionization symbiotics showing for instance [Fe VII]. Thus, ionization potentiel > 100 eV
- He contests previous identications such as Ca X, Na IX, Ne VIII, Fe VI-VIII, P V and show the interesting link with
O VI 3811 and 3834. But, these OVI lines are not observed in symbiotic spectra.
Schmid (1989) resolved the problem: these lines are formed by Raman scattering of OVI photons by neutral hydrogen.
Raman scattering
Raman scattering involves the absorption of a photon followed by the immediate re-emission of a photon at another wavelength The process differs from resonant line scattering: the intermediate line does not correspond to a true bound state of the atom.
Fig 1 show the mechanism of Raman scattering in the case of formation of Raman OVI λ683
A λ1032 photon is produced in O5+ by a transition between 2p 2P0 and 2s 2S levels. The wavelenght of this photon is very close to Lyman β. The λ1032 photon is able to excit the electron on the ground state of Hydrogen aton to an intermediate level between n1 and n2 level. This level is not a true bound state of Hydrogen. In a stabilising transition to true level n1 (Balmer lines level) the election emits a ~ λ6830 photon.
The same for Raman OVI λ7088, but with the initial photon λ1038 (the two transition form a doublet in O5+) - See Fig. 2
Theorical values
Fig. 1 Fig. 2
Observations & theory
From the original lines the theorical intensity ratio I(6830)/I(7088) is 2. The observed ratios are often much higher.
It could result from:
1. In symbiotics the line ratio of doublets are often lower than the theorical value 2 (1.2-1.8)
2. The conversion of OVI λ1032 is much more efficient than that of OVI λ1038 (strongly dependant of the cross section)The wavelength shift Δλ/λ is multiplied by a factor ~ 6.7 according to the wavelength ratio between scattered incident and incident photons (6830/1032 and 7088/1038 resp.)
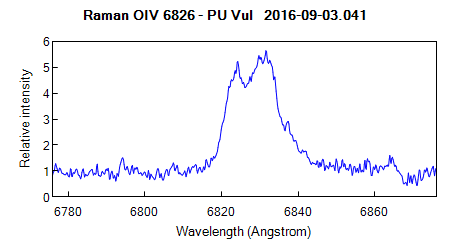
From spectrum of PU Vul obtained on 2016-08-27, the FWHM is 540 km.s-1 and the separation between the two peaks is 240 km.s-1. For the emitted λ 1032 line, the FWHM is 540/6.7 = 80 km.s-1 and the separation of the peaks is 36 km.s-1
Fig. 3 PU Vul - Echelle spectrum R = 11000 - F. Teyssier
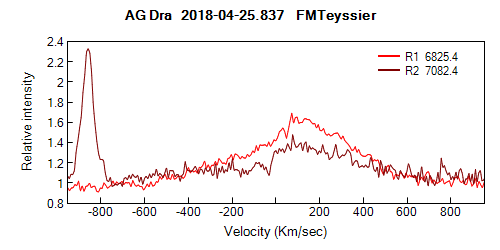
Fig.4 - Raman OVI 6830 (red) and 7088 (brown) in Echelle spectrum of AG Dra
Formation of Raman bands in symbiotic stars
The small cross section for these Raman features implies that the operation of Raman scattering requires a very special condition: a thick H0 region near a strong far UV source.
This condition is met in symbiotic stars where the neutral region surrounding the giant star is illuminated by nebular region ionized by the UV radiation emitted by the very hot white dwarf (T > 100 000 K).
Fig. 5 - Formation of Raman OVI photons - Schematic view
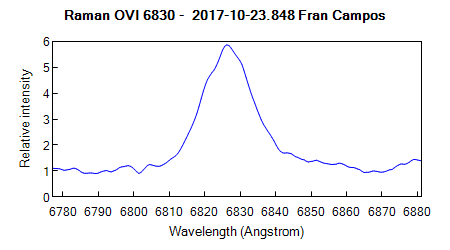
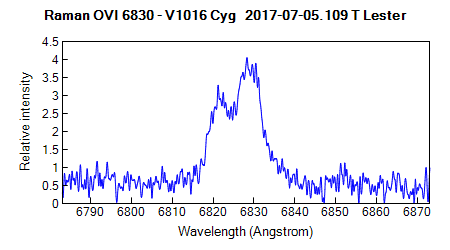
Raman lines in spectra from ARAS Eruptive stars database link
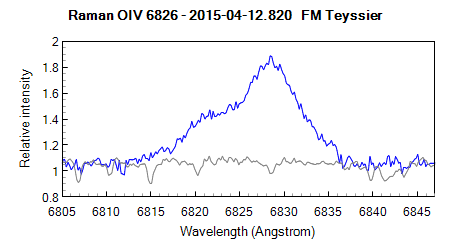
AG Dra Raman bands are very intense in this yellow symbiotic (Giant is a K0-3 III)
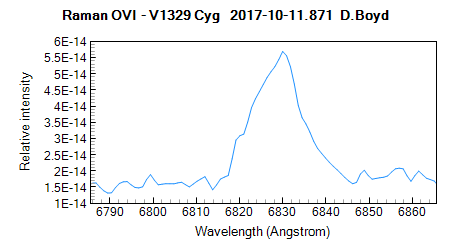
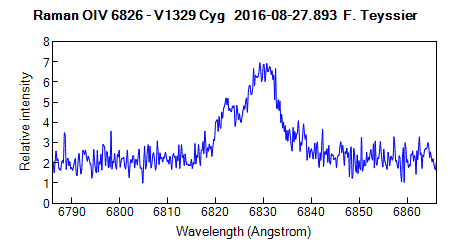
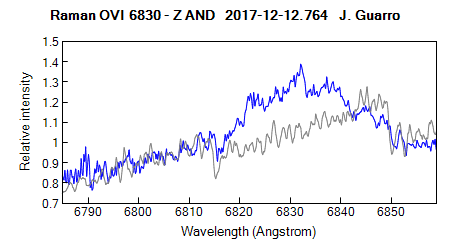
AG Peg HM Sge PU Vul RR Tel V1016 Cyg V1329 Cyg Z And Grey line : pseudo continuum of a reference star of the same type as the giant of the symbiotic Thanks to T. Lester, J. Guarro, D. Boyd, P. Luckas, F. Campos for the spectra
Raman as diagnostic lines
The presence or absence of Raman bands allows an estimation of the excitation class of the nebula (and therefore of the tempetaure of the hot component)
AG Peg - Symbiotic outburst in 2015
In fig. 5 the variations of the equivalent widths of highly ionized lines Raman OVI 6860 and [Fe VIII] during 2015 outburst of AG Peg (Echelle spectra obtained by F. Teyssier)
The visual outburst is the result of expanding envelop of the white dwarf which cools. As the ionization degree decreases, the intensity of highly excited lines declines.
Fig. 5 AAVSO V band lightcurve of the event
Fig. 4 Equivalent widths of Raman OVI 6830 and [Fe VII] 6086 during the double peaked outburst of AG Peg in 2015 - Echelle spectra R = 11000 - F. Teyssier
Sources:
On the unidentified bands 6830, 7088 in symbiotic stars
Allen D.A.
Monthly Notices of the Royal Astronomical Society, vol. 190, Jan. 1980, p. 75-86
http://adsabs.harvard.edu/abs/1980MNRAS.190...75AIdentification of the emission bands at 6830, 7088 A
Schmid H.D
Astronomy and Astrophysics, vol. 211, no. 2, March 1989, p. L31-L34
http://adsabs.harvard.edu/abs/1989A%26A...211L..31SRaman scattering as a diagnostic possibility in astrophysics
Astronomy and Astrophysics, vol. 211, no. 2, March 1989, p. L27-L30
Nussbaumer, H.; Schmid, H. M.; Vogel, M.
http://adsabs.harvard.edu/abs/1989A%26A...211L..27N
Summary
1. Cool component - Spectral type - Wind
2. Hot component - Accretion - Steady burning - Accretion disk
3. Orbital elements
4. Excitation level
5. Emission Lines - Formation - Identification - Diagnostic from lines
6. Outbursts
7. Symbiotic Miras
8. Symbiotic novae
9. Recurrent Novae (Symbiotics)
10. List of bright symbiotic stars
